Tampilkan postingan dengan label social network. Tampilkan semua postingan

Kamis, 05 Mei 2011

Social Interaction on Time

Getting the tweets out on time, actually at the right time, is very easy since the invention of Timely the on time tweet tool discussed earlier in 'Social Networking on Time'. Now the tool has been refreshed.

Timely allows to schedule a whole list of twitter messages and sends them out at the best time optimizing reader outreach. Based on the past 200 tweets a timeframe for best outreach is calculated and following tweets are sent out at exactly the best time.

The tool developed by the flowtown team just got better, with a major update released today. 'Timely Gets An Activity Stream' with stats that are actually transparent and reliable. It is still the basic number, but there is now a drop down menue showing the actual retweets. Each tweet is listed chronologically just like in the Twitter stream. This streamlines the task of finding out who retweeted and in which context. No need to run a search through Twitter, Timely delivers it straight to the dashboard.

timelyUpdate02
Image by single-blogs taken from Timely / single-blogs on Timely with the update listing function of retweets.

Further, it is possible to take it a step further and replay directly to each retweet. It offers basic function of an @tweet. This means thanks and ad-dons can be sent from the same platform. With this the information delivery and management goes in one and the from the ground up rebuilt Performance service gives every ambitious promoter peace of mind out of the box.

As Jason Keath from socialFresh points out: Timely has been open to the public since February, and already needs to expand the capability of their service to account for increased use. The service currently has over 15,000 total accounts and continues to grow.

timelyUpdate01
Image by single-blogs taken from Timely / Timely now allows to directly replay to Twitter users who retweeted timed tweets served through Timely.

Selasa, 29 Maret 2011

LinkedIN by Numbers

The professional version of facebook has now als reached the 100 million user mark and is still growing. LinkedIN the social networking platform for the professional world has published at the beginning of March 2011 their growth in numbers to make a good impression. Founded in 2003 in Santa Monica, California by Reid Hoffman, Allen Blue, Konstantin Guericke, Eric Ly and Jean-Luc Vaillant, the platform has grown to be worth almost $ 3 billion and makes a revenue of over $ 160 million, this is up over 200% from the previous year 2009 at just over $ 80 million.

It was a niche market back the and probably still is. But once your big things settle and a niche can be good business. The main asset linkedIN really has is the content. All these details of businesses, jobs and positions as well as the real people behind it. They say that 73 of the Forbes 100 best companies are using linkedIN hiring systems. This means that the platform hosts a massive amount of details and hors unimaginable stock of knowledge on the worlds markets. These days knowing about the business connections is worth more than actually making business.

Regarding the numbers, there is one more number of the financial sector that is probably interesting. LinkedIN earns about $160 million, but its expenses are almost $150 million. It's actually expensive to know all these details. Presumably most of the cost goes into infrastructure.

In terms of the demographics, LinkedIN hosts over 58% male profiles and only about 42% female profiles. The main user group is between 25 and 50 years old, but the group of 18-25 year olds are also quite keen on the service with over 20%.

In terms of geographical distribution, as you would expect North America is LinkedIN homeland. with about 48% of all the users. The classic blindspots on the map are Africa, South America (except Brasil and Argentina), the Middle East and the Far East (except India). In terms of geographical gender distribution North America is doing better in terms of equality than every body else with 45% f and 55% m, where the Middle East with 23% f and 77% m is the most unbalanced market. However this is presumably not taking the numbers of users into account.

Through out the network the larger companies, over 1000 employees, are the most common. Also Smaller businesses tend to like the service, where medium sized businesses seem to be not that interested. As you would expect the leading branches are hightech 16% and finances 13% with agriculture covering the end with only about 0.4%. In terms of the job function academics are floating towards the top with around 10%, only the sales department is larger with 13%.

Interesting are aso the facts around the use and growth numbers. In terms of time of the day apparently there is a very high after lunch peak over all. During lunch and after lunch really seems to be the time web users find time for the sneaky break to check their social networking status, read a few blos and apply for a better job on inked in. The graph below also incudes the mobile user times and interestingly they mainly access the service after work and in the evening. However I imagine the graph to be slightly out of scale, the mobile users would be a lot smaller in numbers than the actual web users, but never mind. So if you really want this job you better apply before lunch.

linkedIN 2011
Image taken from mashable.com / The linkedIN network by numbers compiled by xxxxx on 2011-03-22.

Via zioigor

Rabu, 02 Februari 2011

Egypt's Internet Blockage - Tweets

The news that Egypt has gone of the internet last Thursday night, stunned the internet community. The news swooshed around quickly and questions were asked. How is this possible, is there a switch?

Over the past years we have learned to appreciate the net as a distributed network of hubs and servers with its own rules. Those being that the internet is not centrally managed and therefore very difficult to govern, even navigate. However, the net of nets is still connected via physical routers, as Andrew Blum in post over at the Atlantic points out.

The move by the Egyptian government was intended to help regain controle over the masses of people who protested for change on the streets of the major cities. The government seemed to believe that the internet and especially social media platforms such as Facebook a and Twitter are increasingly playing a role in the organisation of protests. Cutting Egypt off the web would leave the protesters unable to organise themselves.

Shortly after midnight, about 22h00 UTS, the Egyptian internet providers were asked to take down their routers. One after the other, over a timespan of about 20 minutes, went offline. As a result international IP addresses were unavailable from Egypt.

testGraphCairo_110202
Image taken from renesys.com / The following plot shows the number of available networks for each of the significant providers, between 22:00 and 23:00 UTC last night (midnight to 1am Cairo time). Our new observation is that this was not an instantaneous event on the front end; each service provider approached the task of shutting down its part of the Egyptian Internet separately.
Telecom Egypt (AS8452), the national incumbent, starts the process at 22:12:43. Raya joins in a minute later, at 22:13:26. Link Egypt (AS24863) begins taking themselves down 4 minutes later, at 22:17:10.
Etisalat Misr (AS32992) goes two minutes later, at 22:19:02. Internet Egypt (AS5536) goes six minutes later, at 22:25:10.


The New York Times called it "Egypt, to an unprecedented extent, pulled itself off the grid." and Jim Cowie, chief technology officer of Renesys said “In a fundamental sense, it’s as if you rewrote the map and they are no longer a country.”

The controle of internet content as well as accessibility is not new. Countries around the globe have developed different methods to do this. The most prominent examples are China or Iran, where twitter in 2009 played an important role in organising the political protests as well as distributing information after a disputed election. Earlier single-blogs coverage on mashups HERE.

As part of the New City Landscape (NCL) project we are collecting location based tweets in urban areas. For the last week we also recorded twitter activity in Cairo. And surprisingly twitter activity does not reflect the sudden drop off of international internet connection from Egypt. There is no dramatic reduction of tweets, however there is a continuous reduction of tweets reflected in the data. Over the past five days the location based twitter activity in Cairo has gone from about 250 to 300 messages per hour on Tuesday 27th and Friday 28th down to spikes of 50 on Monday the first of February.

testGraphCairo_110202
Graph by single-blogs / Tweets collected using the TOM tool written by Steven Gray. The tool collects geolocated tweets originating within a 30km radius around the centre of Cairo. The graph shows number of tweets sent per hour.

This is not exactly as expected. There are different possible explanations for this. One of them could be that the internet is a difficult beast to tame and a few routers down don't mean the end of this versatile construct. Via very slow channels it must in this case still be possible to send mainly mobile tweets, even though mobile networks were also reported partially down.

Then on the first of February new information circulated the news channels. Google has put live a new service to allow people in Egypt to tweets via a phone call. After calling a speciall number, +16504194196 , +390662207294, +97316199855, a message can be left that will be posted as a tweet including the hashtag #egypt. The tweet will contain a link to the recorded message. Messages are pushed through this speakToTweet account. Somehow a very political move "We hope that this will go some way to helping people in Egypt stay connected at this very difficult time. Our thoughts are with everyone there."

Regarding out NCL collection this would not change anything since we are only looking at actual geolocated tweets send with Lat/Lon information included.

According to Renesys, Egypt has just this morning around 09h32 UTS returned to the internet after an absence of almost a week. How this will affect the tweeting activity we will see by tomorrow. It will be interesting to see weather this brings back up the numbers to a level of around 100 tweets per hour, we will see. New data and NCL maps are under way.

testGraphCairo_110202
Image taken from renesys.com / All major Egyptian ISPs appear to have readvertised routes to their domestic customer networks in the global routing table, with the exception of Noor Group (AS20928). Recall that Noor was the exception (until Monday) to the Internet blackout, so they are as much an anomaly in restoration as they were in outage. (Update: Noor group back online with a full complement of prefixes as of 12:52pm Cairo time. Better late than never.)

Kamis, 23 Desember 2010

Twitter Art Network - the Big Players

Twitter as an information service has developed rapidly since 2009. Most institutions have by now adopted a twitter account to distribute news and stay in touch with an audience.
Especially in the art world museums and galleries started using the social networking platform, creating important nodes in the twitter univers.

Some art institutions managed to attract a large fellowship with the @Tate for example having about 216,308 followers or the @MoMa with 388,670 followers.

artInstitutions
Graph by single-blogs / Major art museums have adopted twitter as a networking and news channel tool. This art institutions twitter social network is constructed from @ tweets and RT tweets as a directed network graph.
Data collected using 140kit and visualised using gephi.


Of course now of interest is how these nodes link in to the wider twitter network and also how they link to each other. There are of course a number of different interests colliding and this reflects the stiff competition to some extend.

From the most recent 2000 twitter messages by each institution a social network graph was generated to visualise how some of the top museums are connected through activity in tweet terms. The graph represents how the institutions interact with other users and how this connects them into an entangled social network.

artInstitutions_zoom01
Graph by single-blogs / Zoom in on details around the New Yorker museums MoMa, New Museum, Guggenheim and the SFMoMa,

The nodes represent twitter users and the edges, connection lines, are established through @ tweets, a public direct message at some other user(s). The second indicator for established connection are the RT, the retweeting of messages by others.

Interesting to see is how the institutions have rather few direct links, but share quite a bit of intermediate twitter users. Especially between the american institutions there are quite some established connections, but also links across the atlantic are establish. Explore the graph in details below using the Google Maps style navigation.

Art Institutions Social Network

Graph by single-blogs using the GMap Image Cutter / Art Institutions Social Network - Use the Google Maps style zoom function in the top left corner to zoom into the map and explore it in detail. Click HERE for a full screen view.

You can check out the institutions involved on twitter for detailed info on the tweets.
@ZKM, @newmuseum, @tate, @MoMa, @sfmoma, @MOCAlosangeles, @vanabbemuseum, @ModernaMuseet, @mori_art_museum, @centrepompidou, @metmuseum, @guggenheim, @maspmuseu, @V_and_A, @NationalGallery, @npglondon, @_TheWhitechapel

Selasa, 21 Desember 2010

London NCL Social Network Graph - interactive

Following up from the New City Landscape maps, where we mapped tweet densities in urban areas around the world, we have now started to look into the socia network aspects of this data set. As a complementary graph to the map the network illustrates how the twitter users are connected through their activities and usage of the platform.

LND-NCL_NWgraph_s
Graph by single-blogs / The London NCL Social Network graph of twitter users. The dataset is defined as geolocated tweets collected over the period of one week in the urban area of London set to a 30 km radius. Click on the image for a larger version on flickr or see the interactive zoomable version HERE.

The network is built from nodes and edges, were the nodes are the twitter users active during the time period of message collection back in May 2010. The edges visualise the connections between these users. From the messages sent connections are established based on activity and interaction. In reality these are the @ messages that are directed at one or more particular user. The second indicator of a connection are the RT messages, the message that have been retweeted by followers of the creator of the initial message.

LND-NCL_NWgraph-04
Graph by single-blogs / Zoom of the London NCL Social Network graph of twitter users. The dataset is defined as geolocated tweets collected over the period of one week in the urban area of London set to a 30 km radius. Click for a larger version on flickr.

Using these two methods the network graph is established as a directed network, meaning that the connection between the nodes has a direction since a message originates from a sender being delivered to a receiver.

The resulting network is built from a total of 17618 nodes and 26445 edges. In the case of this London twitter network not everyone is connected to everyone and about 5400 subnetworks were identified. Furthermore via the colouring the modularity of the network is visualised. Each subgroups has a unique colour shading indicating groups with tighter connections.

London NCL Social Network

Graph by single-blogs using the GMap Image Cutter / London NCL Socia Network - Use the Google Maps style zoom function in the top left corner to zoom into the map and explore it in detail. Click HERE for a full screen view.

The sizing of the nodes is derived from the number of connections this particular node has for both incoming and outgoing edges.

For the comparison of the networks we are currently working on graphing out the whole range of NCL across the world in order to establish a analysis parameter set. We'll keep you posted about the progress here.

To compare it, the geolocated London New City Landscape map. It is important to keep in mind that the graphs are not spatially representative as compared to the NCL maps which are properly geolocated.

london_contourColour_2
Image by single-blogs using the GMap Image Cutter / London New City Landscape Click HERE for a full screen view.

Senin, 20 Desember 2010

NCL Social Networks

The New City Landscape maps NCL based on twitter messages sent in urban areas represent only one aspect of the data that was collected. For the maps we were focusing on the location at the moment of sending the message.

Now we are looking into the social network of the same data set and visualise how users communicate and how they are interconnected. Using the @'s and RT's in te messages a network was constructed establishing links between users that send directed tweets or retweet someone else's message.

Very quickly these social networks become extremely complicated and computational intensive. The old MacBook here is struggling with the larger networks of London and New York, were there are 20000 or 40000 nodes respectively to be calculated.

However the smaller networks of Paris and Munich draw very nicely in Gephi, the open source graph visualisation software used to render the following images.

The data we are using here was collected over the period of one week and the selection criteria is the geo location. It is a 30km radius around an urban area. This forms the starting point of the network with all the users within this set as seed nodes. Who ever they were in touch with is then added as a secondary node drawing the edges between these nodes.

Munich NCL social network with one very big player standing out, ProSieben. This is one of the big German TV channels.

MUH_ncl_100505_test02_graph
Image by single-blogs / Social network of Munich twitter users corresponding to the Munich New City Landscape map.
The network is derived from @ and RT twitter messages.
This draws to 772 nodes and 1193 edges.


See the corresponding NCL map HERE.

Paris NCL social network
NCL-PRS_graph02
Image by single-blogs / Social network of Paris twitter users corresponding to the Paris New City Landscape map.
The network is derived from @ and RT twitter messages.
This draws to 4959 nodes and 7390 edges.


And a zoom into the Paris twitterNetwork map (bottom right), showing how the main nodes are linking down to smaller one of nodes.

NCL-PRS_graph03
Image by single-blogs / Zoom of social network of Paris twitter users corresponding to the Paris New City Landscape map.
The network is derived from @ and RT twitter messages.
This draws to 4959 nodes and 7390 edges.


See the corresponding NCL map HERE.

The NCL maps cover a lot more cities, see the world map HERE. As these are processed we'll be showing them here on the bog so stay tuned, some exciting network graphs will come up.

Kamis, 02 Desember 2010

Book - Posting Things, any Thing

The good old post service has had a difficult stand with the raise of the digital message. The romantic love letter as well as the intense debating correspondence has largely shifted into the virtual realm of messages on a computer screen. The main content of mail remaining is legal documents that need to be in physical form or parcels. Things still need to be moved.

What the mail service provides, beyond delivering post, is a web of connection. In fact a very dense and very flexible network with numerous elements, links and nodes. These ranges from a post office, to a distribution and sorting centre to the postman in the street delivering.

Based on a detailed system of code every functional unit in the city i accessible through this web an can connect to any other unit. Quite and important and versatile institution this is. In todays cities we relay on a number of such infrastructure systems constructing and serving the urban landscape, such as power networks and streets. However the mail and address system is probably the most flexible one.

Mail correspondence has a long tradition and is looking through historical works, for example in art or science, the letters between different figures in volved act a an important medium of exchange and stimulation.

In a recent visualisation 'Visualizing the Republic of Letters' developed at Stanford University by Daniel Chang, Yuankai Ge, Shiwei Song, Nicole Coleman, Jon Christensen, and Jeffrey Heer the past correspondance of 55'000 letters by 6400 people over about 200 years has be mapped and animated. The visualisation is based on the e-enlightment project, an electronic database for letters and lives. "Electronic Enlightenment reconstructs the extraordinary web of correspondence that marked the birth of the modern world."


In a recent Princeton Architectural Press publication the topic of the mail and especially the parcel i explored from a very different perspective. The book 'The Englishman Who Posted Himself and Other Curious Objects' by John Tingey traces the story of Willie Reginald Bray. It is not just about the person but about the special experiments he staged practically exploring the possibilities of the mail service. Basically he just posted everything and anyone, including himself.

The postal service became very popular with the radical changes in 1840 in prices and structure. The mail needed to be pre payed by the sender (was previously payed by the receiver) and a simplified pricing structure, one penny for a letter in the UK.

Bray however wanted to explore the boundaries of this 'shipping things' on both ends, the side of the object and what could possibly be sent, as well as the coding system, the addresses and the labeling.

Bray
Image taken from fingersports / A picture postcard utilised the image as an element of the address. 'To a resident nearest to these rocks'.

These are very interesting parameter of the service. Bray for example developed a series of postcards with coded addresses that required the postman to deceiver the intended receiver. This could be in the form of a rhyme, writing using wax or using symbols. During the high days of the pictue card area he also utilised these pictures as the address, only with the accompanied instruction "to the resident nearest". The actual address was aso of interest to Bray and he experimente with sending letters and postcards to train drivers for example, as a moving destination.

The object posted in the second categorie ranged from onions to dogs and as mentioned himself. It was in February 1900 that he tested the Mail service and again in November 1903 that he posted himself as a 'Person Cyclist' back home. Bray claimed this to be the first time a person has ever been posted.

The book pulls together this rather curious story about a man's efforts to test out the service that links together across the entire country. And this collection possibly highlights the exact difference between the generally linking infrastructure and this postal linking network. It works in both directions and is in this sense a truly interactive service that can be, as Bray demonstrates customised to a large extend.

Tingey, J., 2010. Englishman Who Posted Himself and Other Curious Objects, the, Princeton Architectural Press.

Also thanks to James from spatialanalysis for the letter link.

Jumat, 07 Mei 2010

Sustainability and the Social Context of Ecological Urbanism

Ecology is one of the most popular words nowadays. We all throw terms in frequently like sustainable, environment friendly, renewable, efficiency, green, climate change. It is now important for Companies, governments, politicians, individuals; to turn green. Some really respect the cause and care about themselves and the planet. While others take advantage of the situation; “green” is now a profitable brand. For good or for bad ecology is know trendy.

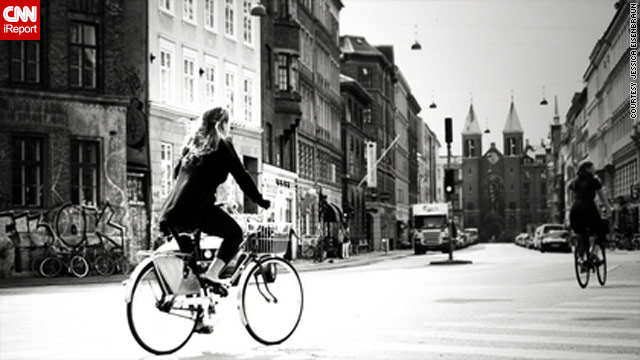
Image taken from CNN / In Copenhagen, Denmark, which has a reputation for accommodating cyclists, Jessica Eisenbraun gets her exercise riding around the city on her steel bike, which is older than she is but easy to maintain. Biking is the fastest way around the city, she says, when you consider how long it would take to park a car or take a bus.

“GREED Vs GREEN” Our contemporary societies are evolving from “greedy to greeny”. Bill Maher, an american comedian and critic said in his show; “greed isn’t good! In fact, is the common threat that runs through all of the problems that this country faces, from financial meltdown, to healthcare, to climate change. Americans will do anything to each other for money...” Twenty years ago greed and consumption were the key factors in any society. Things seem to be changing slowly. Unfortunately we needed get scared the hell out to evolve! We all now fear; Climate change, terrorism and the economy. As a result society is getting a conscious.

Individual consciousness seems to be the answer for this mess. Consciousness about our ways of life by consuming less and taking care of our selves and the environment. Italian Architect Andrea Branzi in his “Weak Metropolis Lecture” at the ecolological urbanism conference in Harvard talked about our attempt to change cities with major architecture projects, and how we must instead focus on smaller scale projects that will be able to penetrate households and cultures. It is in the conscious of the individual that ecological urbanism finds its roots.

Sustainability is the capacity to endure independently. The term is often used in architecture and urbanism for projects that respect or use a minimum of natural resources, the same term can be applied on individuals. The sustainability of the individual must be approached on how the individual takes advantage of the environment with the minimum impact over it. Environment relating to the geographical location, social and cultural surroundings of the habitant. This means that Andrea Branzi arguments are very strong. Even though a large amount of resources could be used in the construction process I do believe that well thought macro projects can bring benefits to a city and small projects like roof productive gardens (not only grass!) in each house hold can definitely create a huge difference on the sustainability of a city. Small viral green projects carried out at a house hold scale or at an individual scale will change the dynamic of the city. It will bring better quality of life to the habitants and it will lower the resources that the city requires.

Image taken from civileats.com / Roof of Abundance, a repot from the frontline of roofgardening in New York by Paula Crossfield. Details can be found in the ‘Roof Garden Rookies’ Category.

An informed individual is a conscious one. Nowadays we can find several web pages that will inform and measure the carbon footprint of individuals or small businesses. For example myfootprint.org, or one that I recently discover and that I really enjoyed is www.changinghabbits.org The 'Changing Habbits' project was initiated, designed and developed by Prof. David Walker and Prof. Rob Holdway of Giraffe Innovation. By responding to some easy questions this website will calculate your carbon footprint and will illustrate it in a fun way, at the end of the exercise you will have a perspective of your house hold habits and some simple tips on becoming greener and on improving your quality of life. The message is simple, wrong habits will make you a fat, ugly and unhappy person! So from a greedy materialistic frightened society we must change our ways into a conscious society. We all are ecological urbanists.

Image taken from changinghabbits.org / cover illustration.

This guest post by Luis Suarez forms part of the discussion on Ecological Urbanism as an single-blogs series .


---
Luis Suarez was born, in Bogotá, Colombia and graduated from The University of Florida in design, construction and planning in 2005. He received a master in science of urban design from The Bartlett School of Architecture, University College London. He is currently pursuing a Masters in Bioclimatic Architecture from The Isthmus School of Architecture for Latin America and the Caribbean. He is designing and building multiple projects in South and Central America with his established firm, Estudio ArQ.

Kamis, 18 Maret 2010

The Identity of the Place

The new Monu Magazine comes with a beautiful quote describing the characteristics of the city as a particular locally sourced parameter that lives and breathes with the citizens.
"Most of our cities are shaped by a particular set of values that does not necessarily lead to high quality urban spaces, but instead to scary, ethically unacceptable and distorted forms." (MONU issue #12, )
This is something we all experience on a daily basis and therefore are very familiar with. However it doesn't stop there. We also contribute to our surrounding, we are part of it. At least since 'The Social Logic of Space' by Hillier and Hanson we also have an attempt to describe and characterize this phenomenon. It it is not the only attempt, but one that claims to be fundamental and 'scientific' i.e. mathematical. But still, it is based on the static concept of the space as a given entity. This doesn't fit together with Open Source, Free Content or User Participation. To some extend with the emerging filed of spatial dynamics research based on the new location awareness technologies is to look into this very same field. Since it focuses on the activity of the citizens directly they finally play the important role in the description of the urban environment. It really comes back to 'You are the City'.

You can brows the magazine on YouTube, for convenience I have simply embedded the clip below, so go a head a flip through the pages.