The session was organised by the Susanne Metlay for the Secure World Foundation and drew together a range of people working on crowd sourcing, online data mining and collaborative mapping. The range of work presented was very broad, but the overarching idea was to bring together these experts and in a concluding plenary discussion the way forward for an emerging field. As an overarching title the term Community Remote Sensing CRS was suggested, hence the title of the session.
Speaking of the variety of presented projects, it ranged from crowd sourcing projects, mainly smart phone based, for mapping and observing the nature environment. For example observations contributing to the national species registry, the mapping the spreading and growth of invasive weeds or the tracking of sessional changes from crowd sourced reports on the state of flowers and threes.
A major group of project was looking at disaster management, with data and information gathering and rapid response. The focus here was on using the crowd as well as the wider science and academic community to quickly mobilise and coordinate recourses in the wake of a disaster event.
A third group of projects focused on distributed systems to generate a wealth of detailed local data by piggybacking on existing resources, such as collecting weather and road information data through a network of vehicle based sensor information.
A fourth area was the mining of existing or online generated information of web services such as social networks.
The Session was opened with a presentation by William Gail from Microsoft Startup Business Group who talked about his vision of a CRS discipline, high lighting the potential as well a the challenges and problems that need to be faced.
Among the main aspects are the question of privacy and ethics, the validation and accuracy of the data as well as the question of ownership. These questions or topics continuously popped up during the whole session in various combinations and contexts.
Gail gave an overview of existing projects and efforts without getting too attached to a certain direction or solution. While trying to setting up CRS as a emerging fields this was essential.
The Virtual Disaster Visualiser VDV software was on the examples focusing on rapid disaster response and offers a platform for viewing, mapping, sharing and handling large quantities of aerial photo based surface information. It for example assists with remote sensing disaster damage assessment and supports the collaboration of numerous contributors and experts. The VDV was developed at the EPIcentre at UCL by Enrica1 Verrucci, Beverley Asams and Tiziana Rossetto.
The software was successfully deployed in the wake of the Haiti earth quake in 2010. The platform was used to coordinate surveys and allowed a team of 150 experts to asses the area of 1000km square within only 96 hours. For this the base data from the satellite processed by SERTIT which documented especially the port au prince area just four hours after the earth quake with a resolution of about 25cm square.

Image taken from National Geographic Blog / Screen view of the Virtual Disaster Viewer.
Two projects from UCLA, presented and co developed by Eric Graham demonstrated the potential of crowd sourced botanical data collections. The 'What's Invasive!' weed project made use of an Android platform application to map and monitor the distribution and growth of invasive weed species in the United States. The idea is to let volunteers submit location based and image information on the weed they happen to find. To do so the software would offer a location based list of weeds that can be reported. With one click the information is submitted to a central server and mapped in real time. The Android app can be downloaded HERE.
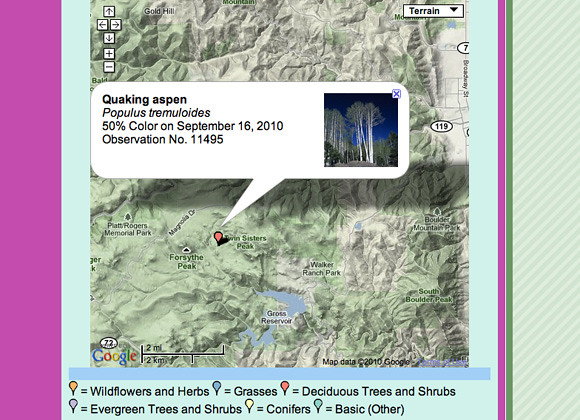
The second project called 'Project BudBurst' is focusing on the tracking of the seasons by collecting plant state information. With this application, also Android based, volunteers can log the progress different plant species make over the course of the year. The plant state is submitted via the app to a central server.
The idea is to get people to observe howler example threes grow buds and start flowering on their daily commute and that these observations can be simple and conveniently reported to simplify the contribution to a nation wide project.
The projects have to show some very promising initial results where the mapping is very successful and accurate as comparison studies show. Furthermore the crowd sourcing aspects allow for a widely distributed collection setup with a lot more reports than individual experts would be able to archive. However the project team has identified the challenges to be with the motivation of volunteers for a continuos contribution rather than one off submissions.

Image taken from Project Bud Burt / A loacation mapped with description popping up on te interactive map.
A massive environmental disaster hit the American Gulf Coast around New Orleans in May this year and the extensive oil spill will dominate the area for years in many ways. From food production, for example sea food businesses, to every day natural impact and animal deaths and large scale loss of habitats.
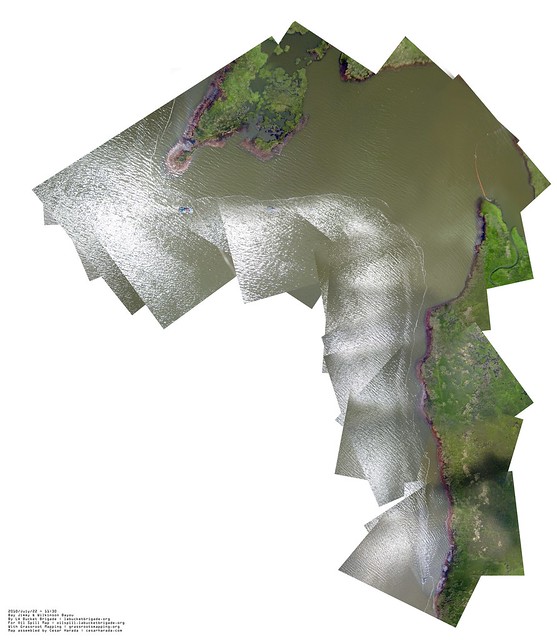
A local initiative to enable the local population to deal with the intense impact is the NGO Luisiana Bucket Brigade. They where in this from day one and they are locals, which means they know the area and especially they know the people. They got involved with the Grassroot mapping project and implemented it as part of their activities in the Gulf area.
The idea is to produced community sourced mappings of the oil spill. The technique was developed at the MIT by
With cheap parts and simple technique the project manages enable nearly everyone to start doing quality mapping. Their Wiki describes all the details of what is required and how to put it in practice.

The images captures b the flying camera are later on stitched together to a high resolution image that can be used to produce the maps. The flight device not necessarily needs to be a helium balloon, but also can be a kit, large enough to carry the additional weight of the cam.

Image by Cesar Harada & Hunter Daniel / Bay Jimmy, Detail 04, 20100722, for : LA Bucket Brigade | labucketbrigade.org/, with : grassrootsmapping.org/, location : 29.468400 ; -89.911300, time : 2010 July 22 @ 10:30AM
This is of course only a very short and incomplete selection of the presented work. The single-blogs contribution can be found HERE. The potential of community based data collection has been realised and can be taken a step further coming from the web 2.0 idea. Once more this session demonstrated the diversity of the possibilities for applications and utility. On the other hand it has also clearly visualised the questions that need to be addressed, starting with ethical and privacy issues all the way to ownership and authority.
Tidak ada komentar:
Posting Komentar