We are left with a huge pile of data that needs processing now and besides all the other stuff calling for attention it is sort of a tricky task. In total we snapped over 200'000 still images, that goes together with the data collected with the GPS that we attached to the SensCam. Additionally we of course also have the log files of the cameras own sensors.
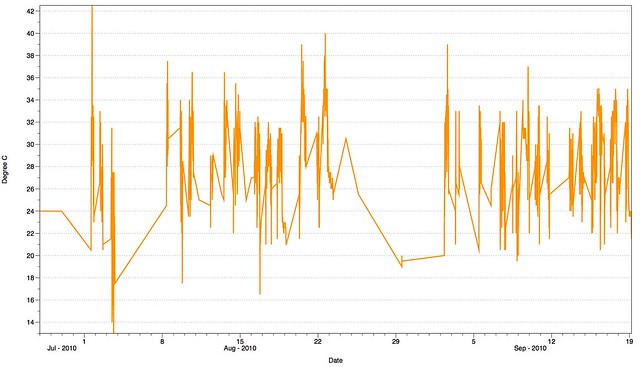
To give a preview example of the temperature logged by the TMP sensor of the camera here is a Graph of this summers temperature. It wasn't too bad, was it this summer?

Image by single-blogs / Temperature curve over the recording period during the summer of 2010, as captured by the SenseCam Revue TMP sensor.
In terms of visualisation one of the main and intense aspect is the image processing and in a temporal sense the animation of this timelapse data makes sense. An earlier preview of some of the captured dat can be found HERE, together with some screen shots.
One of the participants, the artist Kai has also now processed the data she collected during one day of the experiment into a 1 minute clip, showing her every move, covering a mad range of activities. For detailed description and the longlist of different activities visit the artists website at 3rdlifekaidie.
Tidak ada komentar:
Posting Komentar