Tampilkan postingan dengan label Flickr. Tampilkan semua postingan

Selasa, 08 Februari 2011

Invisible Cities - Web 2.0 for the Desktop

Visualising virtual activity location based and linking it visually to the urban locations it takes place is one of the ideas of New City Landscape (NCL). Using the twitter feed the location based tweets are aggregated and the density is mapped as a virtual landscape. This landscape's features are named after the corresponding real world places, creating a sense of place and orientation.

However, so far the NCL maps have been static and in retrospect, representing a week worth of data about the specific urban area they portrait.

Around the same time Christian Marc Schmidt has developed a similar approach focusing on Manhattan, but visualising in real time twitter and flickr activity. The density landscape here is mapped using the aerial photos morphing it over rising and falling peaks. He takes the aspect of real time into account and focuses the visualisation on what is happening just now.

invisibleCities
Image taken from Invisible City / Aerial view of a topic path with the earliest record selected.

The project has now developed in to a standalone desktop version that can be played around with locally. It connects to twitter and flickr loading the most recent activity of the past 24 hours. The applet is Java based and runs on Mac and Windows.

The landscape is based on the activity, each message or photo is shown as a white dot. Hovering over dots reveals the message and details, plus draws links to previous or following messages. These paths are generated from topics listed on te right hand side of the window. If a node belongs to a topic path, navigation will also appear at the top of the view with previous/next buttons to move chronologically along the path.

Schmidt explains: "Invisible Cities, a project named after the novel by Italo Calvino, aims to provide insight into the composition of urban social networks by surfacing data from online services, geographically mapped, in order to identify the areas of high and low activity. The visualization thus reveals emerging social themes, presented in a three-dimensional spatial environment. It displays individual Twitter status updates and Flickr photos on a geo-registered surface reflecting aggregate activity over time. As data records are accrued, the surface transforms into hills and valleys representing areas with high and low densities of data. Data points are connected in chronological order by paths representing themes extracted from status updates and image metadata."

invisibleCities
Image taken from Invisible City / A selected photo as part of a two-node topic path.

You can download the Java App for MacOSx or Windows. A detailed description pdf can be read HERE and the project website with more screnshots and clips can be found HERE.

Rabu, 02 Juni 2010

The Geotaggers' World Atlas

It is online since last week, the Geotaggers' World Atlas derived from geo taged photographs on flickr and picasa. Eric Fischer has put together a series of 100 World cities mapped out by the click of cameras of locals and tourists. By acessing the API's of both flickr and picasa Fischer was able to process thousands of images per location.
Fischer doesn't only plot the location, but takes traces movement by individual photographer including sort of classifying the mode of transport by speed derived from the time stamps. The differen colours read as: black is less than 7 mph (11 km/h), red is less than 19 mph (30 km/h), blue is less than 43 mph (69 km/h) - car, and green is faster.
This is an amazing collection rendered on top of an OSM background layer. Check out the rest of the cities in the flickr set.

The Geotaggers' World Atlas #12: Vancouver
Image by Eric Fischer / The Vancouver Duck, derived from geotaged flickr and picasa photographs. The colouring corresponds to speed of traveling between the different pictures.

Thanks for the link to Matt from Wiser is the Path.


------
2010-06-09 UPDATE

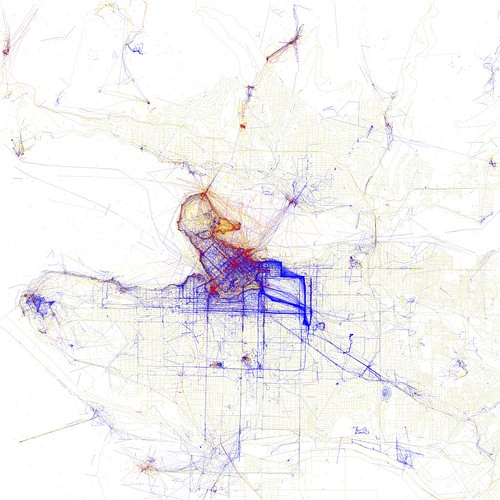
Eric has processed the data further and created a second set of maps of the world cities using the same sources. This time the focus is on who takes the picture and what is this persons relationship to the place. He works with thee categories, local, tourist and not to determine. This highlights the areas of which only locals take snaps in read and areas were predominantly locals, blue, take pictures. Very obvious there are places tourists just don't go to on a short visit to an unknown place, for a number of reasons. This can be lack of knowledge, not knowing the directions or not interested. On the other hand high profile places might not be very interesting for locals. In a lot of the maps large areas are actually covered in blue where locals document their city. New set can be found on flickr.

Locals and Tourists #11 (GTWA #12): Vancouver
Image by Eric Fischer / The Vancouver Duck, derived from geotaged flickr and picasa photographs. Blue points on the map are pictures taken by locals (people who have taken pictures in this city dated over a range of a month or more).
Red points are pictures taken by tourists (people who seem to be a local of a different city and who took pictures in this city for less than a month).
Yellow points are pictures where it can't be determined whether or not the photographer was a tourist (because they haven't taken pictures anywhere for over a month). They are probably tourists but might just not post many pictures at all.

Thanks for the link to Ralph Bartel