Tampilkan postingan dengan label network. Tampilkan semua postingan

Senin, 16 Mei 2011

4/10 Why Mediate Art? - Twitter Text Network

Milan based Mousse magazine is running a series with the title 'Ten Fundamental Questions of Curating'. The editor of the series, Jens Hoffmann explains: "it emerged from a desire to trace the coordinates of contemporary curatorial practice, to take stock of a profession that is constantly evolving. Through the contributions of ten curators, the ten essays in the project examine ten fundamental themes in curating. The booklets are structured as hypothetical chapters in a book that once completed, through the reflections of some of the leading figures in the contemporary scene, will try to offer an answer to the question of “what it means to be a curator today”

I was invited by the London based artist Marysia Lewandowska to collaborate on her contribution to the fourth edition.

Mousse 4/10 Why Mediate Art?
Image taken from Mousse / Page one of '4/10 Why Mediate Art?'.

The fourth instalment of “Ten Fundamental Questions of Curating” looks for an answer to the question “Why Mediate Art?”. The editor Jens Hoffmann invited Maria Lind to contribute who in turn proposed to work with Marysia Lewandowska as an artist curator collaboration. In her text Maria Lind examines the seeming paradoxes that revolve around art institutions: an overabundance of traditional educational activities, aimed at engaging an ever broader public; marketing departments and press offices that take on a strategic role; curators who have no real interest in making their project known outside the professional sphere. The Swedish curator explains the importance of weaving connections between works, curatorial projects and the public, for a new kind of artistic “mediation”. Marysia Lewandowska proposal extends the meaning of mediation in our networked culture by connecting the ‘followers’ of major contemporary art museum and public galleries and Maria Lind’s text through twitter.

Mousse 4/10 Why Mediate Art?
Image taken from Mousse / Page one of '4/10 Why Mediate Art?'. Click Image for the interactive version.

This is the time when art is mediated to its audience not only through lectures, seminars, artists’ talks, guided tours and publications but when mediation intervenes as a pulsating stream of immediacy, mixing the promotional intentions of the institution with the visitors’ desires of sharing their observations and responses. The banal is closely entangled with the political, the randomness is attached to a system as announced by the ubiquitous banner: Twitter is a rich source of instantly updated information. It's easy to stay updated on an incredibly wide variety of topics. By utilising the social networking platforms such as Facebook, YouTube and Twitter that emerged over the past few years, the communication between the art institutions and their audiences has grown into a real time stream of information snippets.

Interactive version created by single-blogs using the GMap Image Cutter / Twitter Education. Tweets collected using 140kit, to visualise the network Gephi was used. Click HERE for the full screen version.

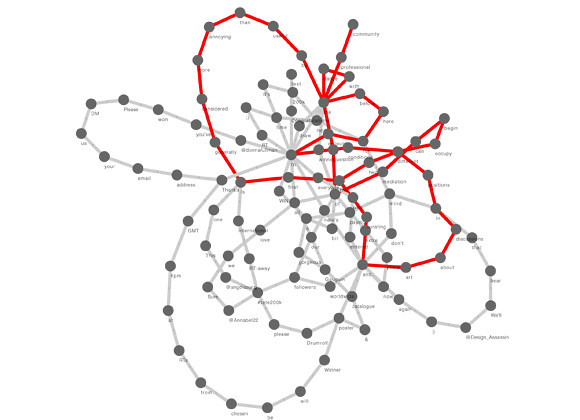
What appears on the visuals are graphs mapping tweets sent by three major art institutions, Tate in London, MOMA in New York and Moderna Museet in Stockholm to communicate and mediate their activities as they are enmeshed together with Maria Lind’s text. The two text streams have been aggregated as a word chain, where each word is connected with a link to the following word in the sentence. Each word is represented only once as a node in the chain, but in many cases with multiple connections, edges, to the following words. The resulting visualisation is of a network based on the structure of the words in use. The two different sources are distinguished where red lines represent the links between the words in the tweets sent by the art institutions, while the black lines show the flow of the essay written by Maria Lind. The tweets cover the period between 2009-09-16,15:18 and 2010-11-29 16:03.

Mousse 4/10 Why Mediate Art?
Image taken from Mousse / Page one of '4/10 Why Mediate Art?'. Tweets collected using 140kit, to visualise the network Gephi was used. Click Image for the interactive version.

For artist Marysia Lewandowska the mapping of this flow expresses a desire and interest in distributive networks without restriction; it is the desire of being in touch and engaged, of organising one’s thoughts and sharing them instantly. The knowledge ecologies of a wider world intersect in unexpected ways and point to the role mediation plays in shaping our current social and political life.

Publication - Mousse, Editor - Jens Hoffmann, Text – Maria Lind, Art – Marysia Lewandowska, published 2011.

Ten Fundamental Questions of Curating, edited by Jens Hoffmann and published by Mousse in collaboration with the Fiorucci Art Trust, is distributed with the international edition of Mousse and with subscription copies.

Interactive version created by single-blogs using the GMap Image Cutter / Twitter Education. Tweets collected using 140kit, to visualise the network Gephi was used. Click HERE for the full screen version.

Rabu, 02 Februari 2011

Egypt's Internet Blockage - Tweets

The news that Egypt has gone of the internet last Thursday night, stunned the internet community. The news swooshed around quickly and questions were asked. How is this possible, is there a switch?

Over the past years we have learned to appreciate the net as a distributed network of hubs and servers with its own rules. Those being that the internet is not centrally managed and therefore very difficult to govern, even navigate. However, the net of nets is still connected via physical routers, as Andrew Blum in post over at the Atlantic points out.

The move by the Egyptian government was intended to help regain controle over the masses of people who protested for change on the streets of the major cities. The government seemed to believe that the internet and especially social media platforms such as Facebook a and Twitter are increasingly playing a role in the organisation of protests. Cutting Egypt off the web would leave the protesters unable to organise themselves.

Shortly after midnight, about 22h00 UTS, the Egyptian internet providers were asked to take down their routers. One after the other, over a timespan of about 20 minutes, went offline. As a result international IP addresses were unavailable from Egypt.

testGraphCairo_110202
Image taken from renesys.com / The following plot shows the number of available networks for each of the significant providers, between 22:00 and 23:00 UTC last night (midnight to 1am Cairo time). Our new observation is that this was not an instantaneous event on the front end; each service provider approached the task of shutting down its part of the Egyptian Internet separately.
Telecom Egypt (AS8452), the national incumbent, starts the process at 22:12:43. Raya joins in a minute later, at 22:13:26. Link Egypt (AS24863) begins taking themselves down 4 minutes later, at 22:17:10.
Etisalat Misr (AS32992) goes two minutes later, at 22:19:02. Internet Egypt (AS5536) goes six minutes later, at 22:25:10.


The New York Times called it "Egypt, to an unprecedented extent, pulled itself off the grid." and Jim Cowie, chief technology officer of Renesys said “In a fundamental sense, it’s as if you rewrote the map and they are no longer a country.”

The controle of internet content as well as accessibility is not new. Countries around the globe have developed different methods to do this. The most prominent examples are China or Iran, where twitter in 2009 played an important role in organising the political protests as well as distributing information after a disputed election. Earlier single-blogs coverage on mashups HERE.

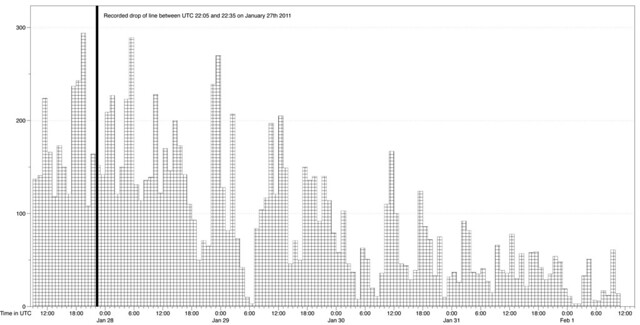
As part of the New City Landscape (NCL) project we are collecting location based tweets in urban areas. For the last week we also recorded twitter activity in Cairo. And surprisingly twitter activity does not reflect the sudden drop off of international internet connection from Egypt. There is no dramatic reduction of tweets, however there is a continuous reduction of tweets reflected in the data. Over the past five days the location based twitter activity in Cairo has gone from about 250 to 300 messages per hour on Tuesday 27th and Friday 28th down to spikes of 50 on Monday the first of February.

testGraphCairo_110202
Graph by single-blogs / Tweets collected using the TOM tool written by Steven Gray. The tool collects geolocated tweets originating within a 30km radius around the centre of Cairo. The graph shows number of tweets sent per hour.

This is not exactly as expected. There are different possible explanations for this. One of them could be that the internet is a difficult beast to tame and a few routers down don't mean the end of this versatile construct. Via very slow channels it must in this case still be possible to send mainly mobile tweets, even though mobile networks were also reported partially down.

Then on the first of February new information circulated the news channels. Google has put live a new service to allow people in Egypt to tweets via a phone call. After calling a speciall number, +16504194196 , +390662207294, +97316199855, a message can be left that will be posted as a tweet including the hashtag #egypt. The tweet will contain a link to the recorded message. Messages are pushed through this speakToTweet account. Somehow a very political move "We hope that this will go some way to helping people in Egypt stay connected at this very difficult time. Our thoughts are with everyone there."

Regarding out NCL collection this would not change anything since we are only looking at actual geolocated tweets send with Lat/Lon information included.

According to Renesys, Egypt has just this morning around 09h32 UTS returned to the internet after an absence of almost a week. How this will affect the tweeting activity we will see by tomorrow. It will be interesting to see weather this brings back up the numbers to a level of around 100 tweets per hour, we will see. New data and NCL maps are under way.

testGraphCairo_110202
Image taken from renesys.com / All major Egyptian ISPs appear to have readvertised routes to their domestic customer networks in the global routing table, with the exception of Noor Group (AS20928). Recall that Noor was the exception (until Monday) to the Internet blackout, so they are as much an anomaly in restoration as they were in outage. (Update: Noor group back online with a full complement of prefixes as of 12:52pm Cairo time. Better late than never.)

Kamis, 20 Januari 2011

Cytoscape - Networking

The rise of network research and visualisation in the past ten years was dramatic. From initial ideas and clunky software programs we now see a number of great open source platforms appearing.

The concept of network visualisation is rather simple, there are two elements, nodes and they have a relationship, called edge. From here both nodes and edges between them are added and complicated systems can be represented in terms of how the identified elements are connected, simple.

Nicholas Christakis talks in his TED talk at the top of his voice about the basics of social networks and outlines the dreams, implicating the power of network.


However this is on the visualisation level, where it looks simple. The real task lies before and after this. How are the nodes and edges actually defined and identified in the run up to the funky visualisation of clusters and groups? This question in both a practical definition sense as well as in a technical sense of how is the input file generated is the real task.

This is to some extend reflected in the file standards of these network visualisation softwares, there aren't any. The whole area might be to young and the big player is missing, like ESRI in GIS or Autodesk in CAD. This might be part of the explanation, but the other part is that the simplicity of node and edge hasn't put pressure on the file formats.

Since last year the Gephi platform is setting standards for this group of open source network visualisation softwares. It offers great functions and juicy looking visuals with a easily manageable interface.

Developed by a consortium of universities and research companies, including the University of California San Francisco and the University of Toronto, comes a second very powerfull and flexible network software called Cytoscape. The software is not new as new, development reaches back to 2002 where version v0.8 was released. Currently version 2.8 is available for download and work on version 3.0 in underway although there is no release date as of now.


DAG
Image taken from cytoscape / Visualization of Gene Ontology Term Tree (DAG). More images can be fond in this flickr group

Cytoscape initially was developed for biology and molecular research, has however developed into a multipurpose network visualisation platform. The software is JAVA based and therefore rund across platforms with a lot of plugIns freely available. Basicaly everyone can contribute their own plugIns.

Cytoscape suport variety of standarts, see above, but for quick and dirty the text or table import is extremely useful. If you have a table or CSV with three columns, defining the start node end node and the type of relationship you are good to go. This addresses some of the issues discussed above.

Running the visualisation algorithms can be processing intensive especially once the network goes above 10'000 nodes. Here Cytoscape performs very good also from a interface perspective. The progress is clearly indicated and each process can be stopped at anytime. Usually it is very stable and would not crash on you all of a sudden, even with large network calculations.

The package comes with a lot of preset layout algorithms. These sets hold the definitions of how the graph is going to evolve and the nodes and edges are laid out. The selection ranges from force directed, weighted to circular or grid layouts. Each preset layout can be fully adjusted.

Regarding the visualisations graphically, here Cytoscape is extremely flexible and every single aspect of the graph can be manually set. This is great and makes for a dramatic flexibility, but on the other hand it is painstakingly difficult and time consuming. Especially if working on a dataset early on and results are not yet clear it is not were you put your effort and ugly visuals can be depressing.
Anyway the great examples on the website should be consulted for motivation.

Some of the other great features include Cytoscape works as a Web Service Client, great search functionality for nodes and edges as well as extensive filter functions, useful not only to hide or show, but to highlight. Furthermore it allows for custom node representation. This means Cytoscape can display images and icons individually for each node. Cytoscape also supports networks within networks, quite a tricky thing.

TNexample_text01g-text02r
Image by single-blogs / Visualisation of two text snippets as a network.

Two things are crucial now that the data is compiled and graphed, the analysis and the output. In both cases Cytoscape is very powerful. Extensive analysis function very detailed spits out numbers and even puts them on graphs. All these tables and calculations can be exported too to further analysis in external packages. Regarding the output of the graph a palett of formats are offered, covering both image formats as well as graphic formats such a s PDF, EPS and SVG.

If you are into network visualisation and keen on a good alternative to established packeges such a Pajek this might be one for you. More recources on Cytoscape can be found on pubMed or GenomeResearch.